Machine learning algorithms is transforming the world around us. It powers everything from product recommendations on Amazon to medical diagnosis tools in hospitals. But how does it work? At its heart are algorithms that allow machines to learn patterns from data and make predictions or decisions.
This guide will introduce you to the top 10 machine learning algorithms every data scientist should know. We’ll break down each algorithm, explain how it works, and highlight its applications, advantages, and disadvantages. Let’s get started!
1. What is Machine Learning?
Machine learning is a branch of artificial intelligence that focuses on making machines learn from data. Instead of programming every step, we provide machines with data, and they learn patterns to make decisions or predictions.
This differs from traditional programming, where rules are explicitly coded. Machine learning models improve over time as they are exposed to more data. For instance, Netflix’s recommendation engine becomes better as you watch more shows.
The key is that machine learning algorithms adapt and learn without needing constant reprogramming. This makes them incredibly powerful tools in fields like healthcare, finance, and entertainment.
2. Types of Machine Learning Algorithms
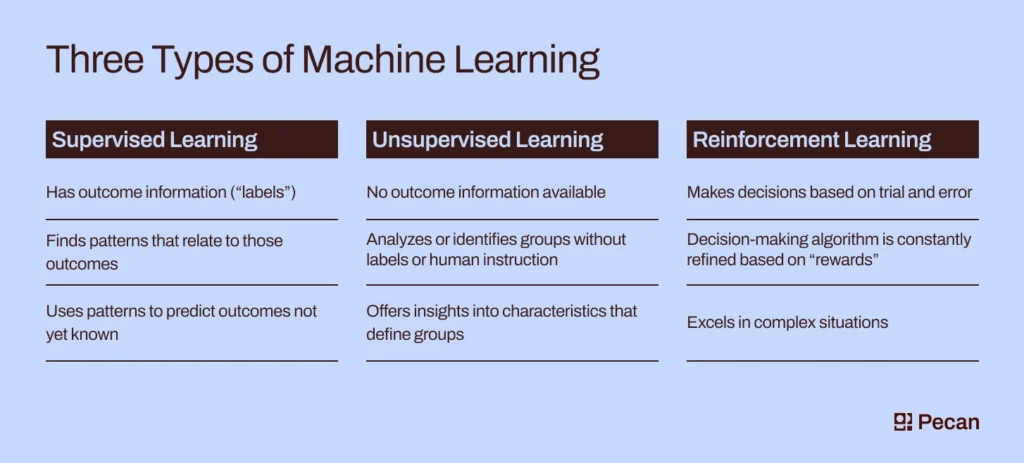
Machine learning algorithms are categorized based on how they learn. Understanding these types is essential to choosing the right one for your problem.
Supervised Learning
Supervised learning uses labelled data, meaning the input comes with known output. The algorithm learns the relationship between input and output to make predictions.
- Examples: Linear Regression, Logistic Regression, Support Vector Machines.
- Applications: Predicting housing prices, email spam detection, and credit scoring.
Unsupervised Learning
Unsupervised learning deals with unlabeled data. It finds hidden patterns, such as clustering similar data points together.
- Examples: K-Means Clustering, Principal Component Analysis.
- Applications: Customer segmentation, anomaly detection, and recommendation systems.
Reinforcement Learning
Reinforcement learning is like trial and error. An agent interacts with an environment, receiving rewards or penalties, and learns to make better decisions.
- Examples: Q-Learning, Deep Q-Networks.
- Applications: Self-driving cars, game AI, and robot navigation.
Semi-Supervised Learning
Semi-supervised learning combines small labelled data with large amounts of unlabeled data. It’s useful when labelling data is time-consuming or expensive.
- Examples: Self-training models in natural language processing.
- Applications: Fraud detection, medical diagnosis, and text classification.
Self-Supervised Learning
Self-supervised learning generates labels from the input data itself. It’s a cutting-edge approach used in deep learning tasks.
- Examples: Pretraining models like GPT or BERT.
- Applications: Chatbots, text summarization, and machine translation.
Q. Why is it important to understand different machine learning algorithms?
Understanding different machine learning algorithms is crucial because they are the foundation of solving diverse problems using data. Each algorithm is designed to address specific types of tasks, and knowing them helps you choose the best approach for a given situation. Here’s why this knowledge is so important:
1. Problem Specific Solutions
Different problems require different tools. For instance, linear regression is ideal for predicting continuous values, while decision trees excel in classification tasks. Understanding algorithms enables you to pick the right one for accurate and efficient results.
2. Improved Model Performance
Selecting the right algorithm can significantly impact the performance of your model. Algorithms vary in how they handle data, manage outliers, and interpret relationships. Understanding these differences allows you to optimize model performance and achieve more accurate predictions.
3. Efficient Use of Resources
Different algorithms require varying levels of computational power and time. Deep learning models, for instance, need significant resources compared to simpler models like K-Nearest Neighbors. Knowing this helps you match the algorithm to your available resources, ensuring efficiency.
4. Better Data Handling
Algorithms respond differently to various data types and structures. Some handle missing values and outliers well, while others don’t. By understanding these nuances, you can preprocess your data more effectively and choose an algorithm that complements your data characteristics.
5. Enhanced Interpretability
In some cases, you need models that stakeholders can easily understand. Algorithms like Decision Trees offer high interpretability, making them suitable for explaining decisions. Conversely, more complex models like Neural Networks might provide better accuracy but are harder to interpret. Understanding these trade-offs is essential for balancing accuracy and transparency.
6. Adaptability to New Challenges
Machine learning is a rapidly evolving field. New algorithms and techniques emerge frequently. Being familiar with various algorithms enhances your adaptability and keeps you at the forefront of technological advancements. It allows you to leverage the latest developments to solve new and complex problems.
7. Effective Problem-Solving
Complex problems often require a combination of algorithms. For instance, you might use clustering to identify patterns and then apply classification for detailed analysis. Understanding different algorithms enables you to design effective hybrid solutions.
8. Informed Decision-Making
Having a broad knowledge of algorithms empowers you to make informed decisions. Whether it’s choosing the right model for a project or explaining your approach to stakeholders, understanding various algorithms provides a solid foundation for sound decision-making.
In summary, understanding different machine learning algorithms is vital for selecting the right tool for the job, optimizing performance, managing resources, handling data effectively, ensuring interpretability, adapting to new challenges, solving complex problems, and making informed decisions. This knowledge is foundational for any data scientist or machine learning practitioner.
3. The Top 10 Machine Learning Algorithms
Here is the list of top 10 machine learning algorithms you should know if you are a computer science student and want to enhance your knowledge.
1. Linear Regression
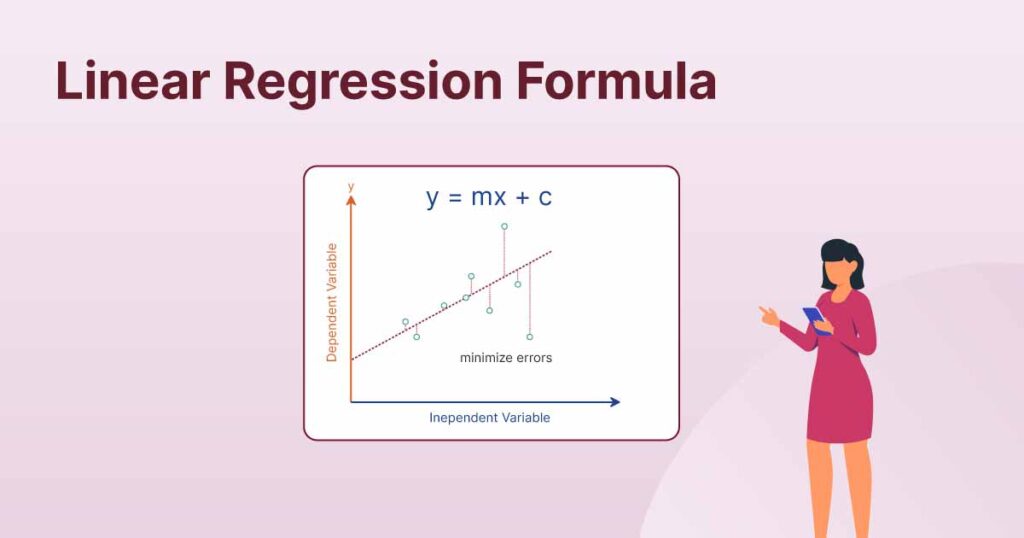
Linear regression is a machine learning method used to predict a continuous value, like how much a car might sell for based on its age or mileage. It works by finding a relationship between two variables: one that you know (input, or X) and one that you want to predict (output, or Y). This relationship is represented as a straight line on a graph, making it easy to see how the input affects the output.
The algorithm works by analyzing your data points (pairs of X and Y values) and calculating the “best-fit line” that goes as close as possible to all the points. This line is described by a simple equation: Y=mX+bY = mX + bY=mX+b, where mmm is the slope (showing how steep the line is) and b is the intercept (where the line crosses the Y-axis). Once this line is created, you can use it to predict new Y values for any X value.
Linear regression is most helpful when you want to understand how one thing impacts another. For example, if increasing study hours improves test scores, the slope mmm will tell you how much improvement to expect per extra hour studied. It’s a simple yet powerful way to make predictions and uncover trends in data!
- How It Works: It fits a straight line through the data that minimizes errors. The line’s slope and intercept define the relationship between variables.
- Applications:
- Predicting house prices based on area and location.
- Forecasting sales trends for businesses.
- Estimating insurance costs based on age and health.
- Advantages:
- Simple and easy to understand.
- Requires minimal computational resources.
- Works well with small datasets.
- Disadvantages:
- Prone to overfitting with too many features.
- Assumes a linear relationship, which may not always hold.
- Sensitive to outliers.
2. Logistic Regression
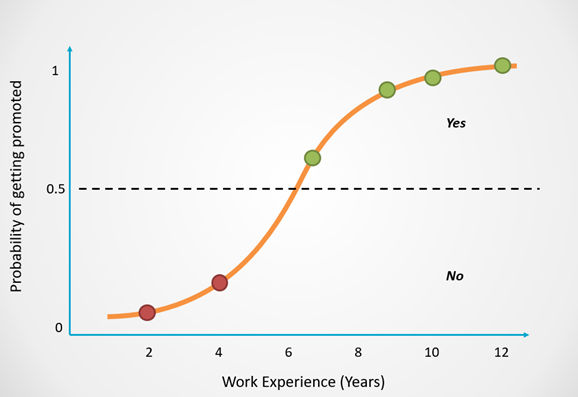
Logistic regression is a way to predict if something belongs to one group or another, like figuring out if an animal is a dog or a cat, or if someone will win or lose a game. Instead of giving a number like in linear regression, it helps us decide “yes” or “no.”
The algorithm works by using data points to find a curve, rather than a straight line, that best separates the categories. Logistic regression uses a special mathematical function called the “sigmoid function,” which takes any input value (X) and squishes it into a range between 0 and 1. These values represent the probability of an outcome. For example, if the result is 0.8, it means there’s an 80% chance of “yes” and a 20% chance of “no.”
Logistic regression is useful for classification problems where you want to predict a category based on certain inputs. It helps us understand how likely something is to belong to one group or another, and by setting a cutoff (like 0.5), we can confidently decide which category to assign. This makes it a powerful tool for tasks like diagnosing diseases or identifying customer preferences.
- How It Works: It uses the logistic function (sigmoid curve) to map predictions between 0 and 1. The threshold determines the classification.
- Applications:
- Detecting fraudulent credit card transactions.
- Classifying customers as potential buyers or not.
- Diagnosing diseases based on symptoms.
- Advantages:
- Easy to implement and interpret.
- Performs well with binary classifications.
- Works with small and simple datasets.
- Disadvantages:
- Struggles with complex, non-linear relationships.
- May require feature scaling for better performance.
- Limited to binary or multi-class classification tasks.
3. Decision Trees
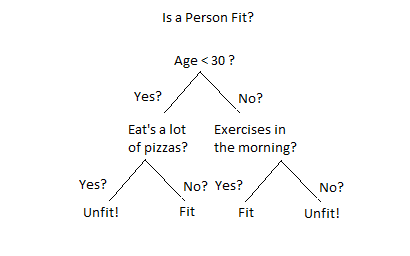
A decision tree is a simple way to make decisions based on questions. It works like a flowchart where each question helps you figure out the answer, like “Is the weather sunny?” or “Is it cold outside?” At the end of the tree, you get a decision, like “Go to the park” or “Stay indoors.”
The tree starts with one big question (called the root) and splits into branches based on the answers. Each branch asks another question until it reaches a final answer (called a leaf). For example, if you’re deciding what sport to play, the tree might ask first about the weather and then about what equipment you have.
Decision trees are helpful because they break complex problems into simple steps. They’re easy to understand and use, making them a great tool for making predictions or solving problems like deciding what movie to recommend or diagnosing an illness.
- How It Works: The tree splits data by choosing features that best separate outcomes. Each branch represents a decision, leading to an output.
- Applications:
- Customer segmentation for marketing.
- Risk assessment in insurance underwriting.
- Predicting product demand in supply chains.
- Advantages:
- Easy to visualize and interpret.
- Handles both numerical and categorical data.
- Requires minimal preprocessing.
- Disadvantages:
- Can overfit, especially with deep trees.
- Sensitive to small data changes.
- Requires pruning to improve generalization.
4. Random Forest
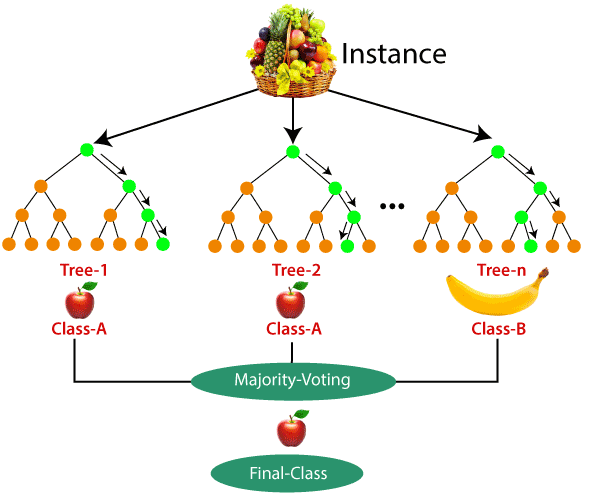
A random forest is like a team of decision trees working together to make better decisions. Each tree looks at the data in a slightly different way and gives its answer, like a group of friends voting on what movie to watch. The random forest takes all their answers and picks the one that gets the most votes.
Each tree in the forest works just like a regular decision tree, but it uses random parts of the data to ask its questions. This randomness helps make the forest smarter because the trees focus on different details and don’t all make the same mistakes.
Random forests are great because they’re more accurate and reliable than a single decision tree. They’re used to solve tricky problems, like predicting whether it will rain tomorrow or figuring out if a customer will like a new product. The “teamwork” of the trees makes the predictions stronger and more trustworthy.
- How It Works: Each tree in the forest is built using a random subset of data. The final output is the average (for regression) or majority vote (for classification).
- Applications:
- Predicting stock prices in financial markets.
- Detecting diseases in medical imaging.
- Evaluating loan eligibility for banks.
- Advantages:
- Reduces the risk of overfitting.
- Handles large datasets and many features.
- Works well with both classification and regression tasks.
- Disadvantages:
- Computationally intensive for large datasets.
- Difficult to interpret compared to single Decision Trees.
- May struggle with highly imbalanced datasets.
5. Support Vector Machines (SVM)
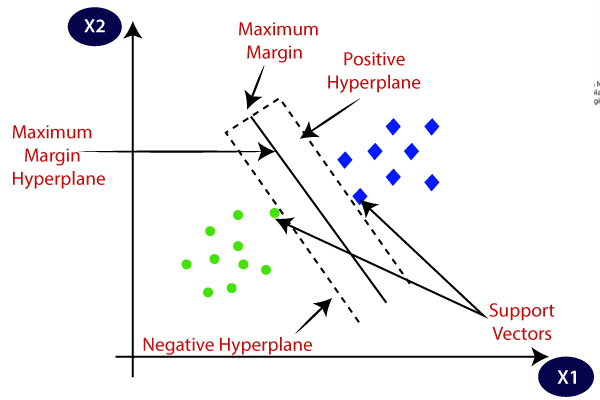
Support Vector Machines (SVM) is a method used to classify things into two groups, like deciding if a picture shows a dog or a cat. It works by drawing a line (or a curve) that separates the groups as clearly as possible. The goal is to find the “best” line that divides the groups with the largest gap between them.
Imagine you have two sets of points on a graph, one for dogs and one for cats. SVM looks for the line that keeps the points from each group as far apart as possible while still separating them. If the data is complicated and can’t be split with a straight line, SVM can create more complex boundaries by mapping the data to a higher dimension.
SVM is useful because it focuses on the hardest-to-classify points near the boundary, making it very precise. It’s often used for tasks like face recognition, spam detection, or deciding if a product review is positive or negative.
- How It Works: SVM identifies a hyperplane that maximizes the margin between classes. For non-linear data, it uses kernel functions to map data to higher dimensions.
- Applications:
- Classifying text into categories (e.g., news topics).
- Identifying faces in images.
- Predicting gene expression in bioinformatics.
- Advantages:
- Works well with high-dimensional data.
- Effective for both linear and non-linear problems.
- Robust to overfitting in smaller datasets.
- Disadvantages:
- Requires careful parameter tuning.
- Computationally expensive with large datasets.
- Difficult to interpret in complex cases.
6. K-Nearest Neighbors (KNN)
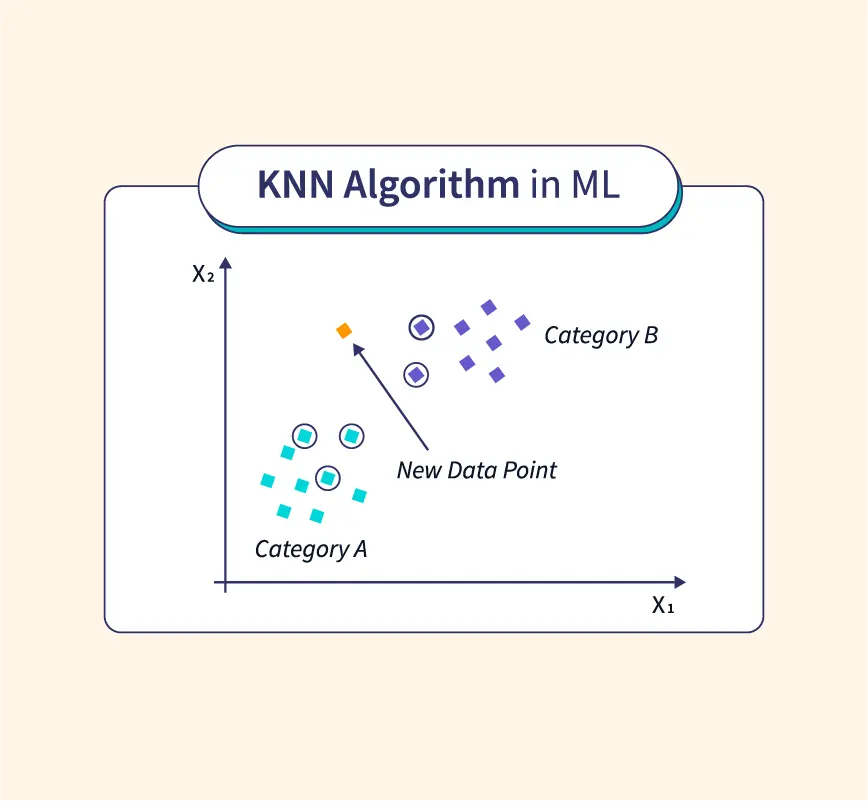
K-Nearest Neighbors (KNN) is a simple way to classify things based on what’s around them. It works like this: when you want to decide what group something belongs to, you look at the closest examples (neighbours) and see which group they are in. The item is then classified into the group that most of its neighbours belong to.
Imagine you’re at a party and want to find out if someone likes pizza or burgers. You ask their nearest friends. If most of them like pizza, you guess that person does too. KNN uses this same idea but with numbers and data points on a graph.
KNN is helpful because it’s easy to understand and doesn’t require a lot of complicated math. It’s used for tasks like recommending movies, identifying handwriting, or spotting patterns in medical data. The more examples it has, the better it gets at making decisions!
- How It Works: KNN calculates the distance between a data point and its neighbours. It classifies the point based on the majority class.
- Applications:
- Recommending similar movies on streaming platforms.
- Identifying handwritten digits.
- Grouping customers based on purchasing patterns.
- Advantages:
- Easy to implement and understand.
- No need for model training.
- Flexible for classification and regression tasks.
- Disadvantages:
- Computationally intensive with large datasets.
- Sensitive to irrelevant or redundant features.
- Performs poorly with imbalanced classes.
7. Naive Bayes
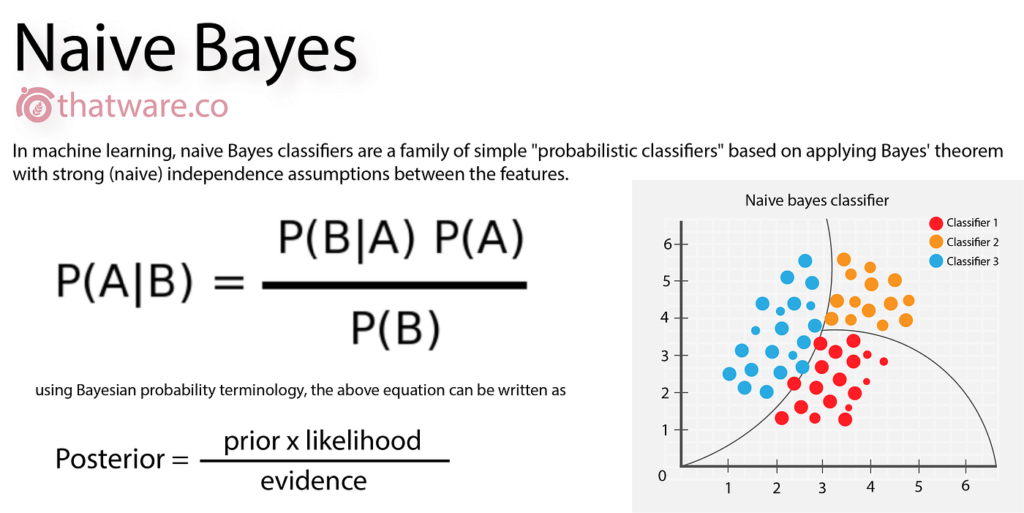
Naive Bayes is a probabilistic algorithm based on Bayes’ Theorem. It is a simple way to classify things based on probabilities. It looks at the features (like colour, size, or shape) of an item and uses the likelihood (probability) of those features happening in each group. It then picks the group with the highest probability, making it a fast and easy way to make decisions.
Imagine you’re trying to figure out if an email is spam or not. Naive Bayes looks at things like certain words in the email and calculates how likely it is that those words show up in spam or non-spam emails. It then combines all these probabilities to decide which category the email fits in.
Naive Bayes is called “naive” because it assumes that all the features (like words or characteristics) are independent of each other, which isn’t always true, but it still works well in many cases. It’s commonly used for tasks like spam detection, sentiment analysis (figuring out if a review is positive or negative), and classifying news articles.
- How It Works: It calculates the posterior probability of a class given a feature, using the prior probability and likelihood of the feature within the class. The class with the highest posterior probability is chosen as the prediction.
Applications:
- Spam Detection: Classifying emails as spam or non-spam.
- Sentiment Analysis: Determining whether a review is positive or negative.
- Document Classification: Categorizing news articles or research papers.
Advantages:
- Fast and easy to implement.
- Performs well with large datasets.
- Handles categorical data effectively.
Disadvantages:
- Assumes feature independence, which may not hold in real-world data.
- Struggles with complex relationships between features.
- Not suitable for continuous variables without preprocessing.
8. K-Means Clustering
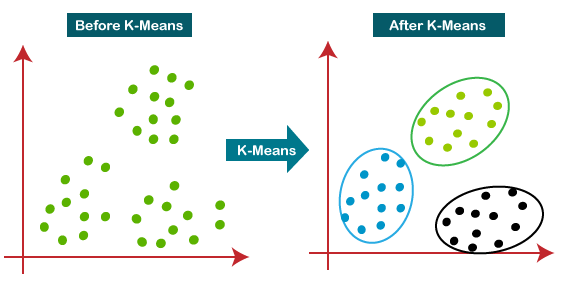
K-means clustering is an unsupervised algorithm used to group data points into clusters. It finds natural groupings in data by minimizing the distance between points in the same cluster.
K-Means Clustering is a method used to group similar things together. It works by dividing data into clusters, which are groups of points that are close to each other. The goal is to find patterns and group the data without knowing in advance what the groups should be.
Imagine you have a bunch of scattered marbles in different colours, but you don’t know their colours. K-Means will organize them into groups based on their positions. First, it picks random spots as cluster centres (called centroids). Then, it moves the marbles into the closest cluster. After that, it adjusts the cluster centres and repeats until everything is grouped nicely.
K-Means is useful for finding patterns when you don’t already have labels for the data. It’s often used for things like customer segmentation (grouping people with similar buying habits), image compression, or organizing documents into topics. It’s a great way to make sense of messy data!
- How It Works: It assigns each data point to one of kkk clusters based on its similarity to the cluster centroid. The centroids are iteratively updated to reduce the overall distance between points and their assigned centroids.
Applications:
- Customer Segmentation: Identifying groups of customers with similar purchasing habits.
- Market Research: Analyzing consumer preferences and trends.
- Image Compression: Reducing the number of colours in an image by clustering pixel values.
Advantages:
- Simple and intuitive.
- Scales well to large datasets.
- Effective for data exploration.
Disadvantages:
- Requires predefining the number of clusters (kkk).
- Sensitive to outliers and noisy data.
- May converge to a local minimum instead of a global solution.
9. Principal Component Analysis (PCA)
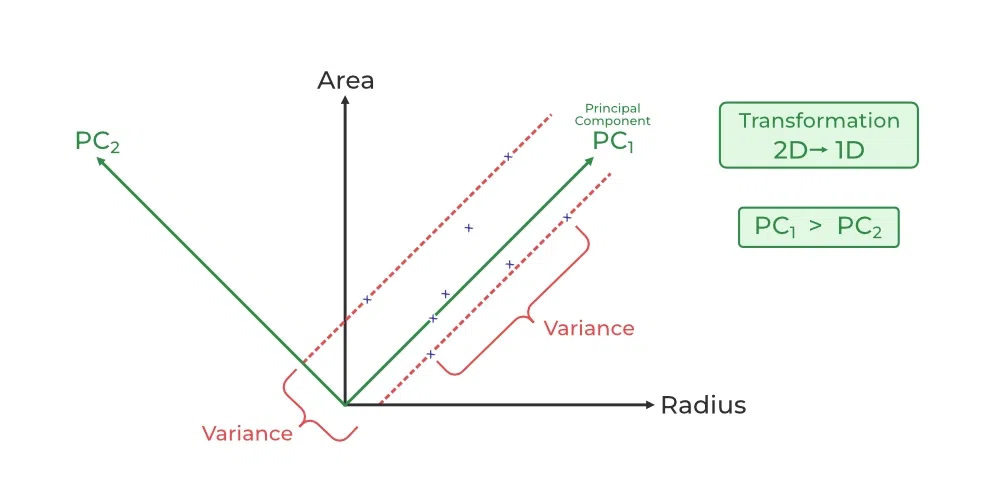
Principal Component Analysis (PCA) is a dimensionality reduction technique that transforms data into a lower-dimensional space. It retains the most important features while discarding less significant ones.
It is a method used to simplify complex data while keeping its important patterns. It takes data with lots of features (or dimensions) and reduces it to fewer dimensions, making it easier to understand and work with.
Imagine you have a big stack of pictures of different animals, but each picture has too many details to analyze easily. PCA finds the main patterns (like shapes or colours) that best describe the animals and uses just those patterns to represent each picture. This way, you still capture the essence of the data but with much less information.
PCA is helpful when working with large datasets, especially when there are too many features to handle. It’s used in tasks like compressing images, reducing noise in data, or even visualizing data in 2D or 3D to see patterns more clearly. It’s a powerful tool for simplifying data while keeping the big picture intact.
- How It Works: PCA identifies the principal components, which are linear combinations of the original features, maximizing variance along each component. These components form the new feature space.
Applications:
- Data Visualization: Simplifying high-dimensional data for better visual interpretation.
- Noise Reduction: Filtering out less relevant information.
- Feature Engineering: Reducing redundant features in datasets.
Advantages:
- Reduces computational cost and complexity.
- Helps in understanding the data structure.
- Retains most of the variance in data.
Disadvantages:
- Loses interpretability of transformed features.
- Sensitive to scaling of data.
- May not capture complex non-linear relationships.
10. Neural Networks
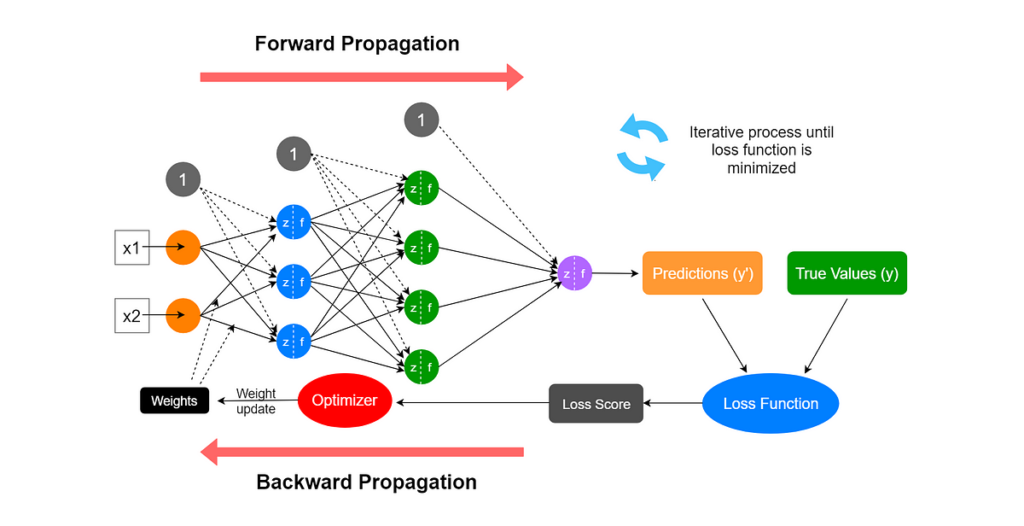
Neural networks are computer systems inspired by how the human brain works. They are made up of layers of connected “neurons” that process information and learn patterns. Neural networks are great at solving complex problems, like recognizing faces, understanding speech, or predicting outcomes.
Imagine a neural network as a web of connected points. Each point takes in information, like the brightness of a pixel in an image, and passes it along to the next layer, making adjustments along the way. By looking at lots of examples, the network learns how to connect the dots to get the right answer, like identifying a picture of a cat.
Neural networks are powerful because they can handle huge amounts of data and learn on their own, even when the patterns are hard to spot. They’re used in many areas, such as self-driving cars, virtual assistants, and medical diagnosis, making them one of the most exciting tools in technology today.
- How It Works: Neural Networks consist of input, hidden, and output layers. Each layer transforms data using weights, biases, and activation functions. The model learns by adjusting weights to minimize errors during training.
Applications:
- Image Recognition: Identifying objects in photos or videos.
- Natural Language Processing: Translating text or generating human-like responses.
- Speech Recognition: Converting spoken words into text.
- Medical Diagnosis: Detecting diseases from medical images or patient records.
Advantages:
- Capable of modelling complex, non-linear relationships.
- Highly versatile and adaptable.
- Can handle large-scale datasets with many features.
Disadvantages:
- Requires a significant amount of data and computational power.
- Difficult to interpret the inner workings (black-box nature).
- Prone to overfitting without proper regularization techniques.
Supervised vs. Unsupervised vs. Reinforcement Learning Algorithms
Machine learning algorithms are divided into three main types: Supervised Learning, Unsupervised Learning, and Reinforcement Learning. Think of them as different ways a computer learns from data.
- Supervised Learning is like learning with a teacher. The computer gets labelled data, meaning it already knows the answers (like flashcards with questions and answers). The goal is to use these examples to predict the answers for new data. For example, teaching a computer to recognize cats by showing it pictures of cats labelled “cat.”
- Unsupervised Learning is like exploring without a guide. The computer gets data without labels, so it doesn’t know the answers upfront. It looks for patterns, like grouping similar things together. For example, if you give it pictures of animals, it might group cats, dogs, and birds without knowing their names.
- Reinforcement Learning is like learning through trial and error. The computer tries different actions in an environment, gets rewards for doing well, and learns from mistakes when it doesn’t. For example, teaching a robot to play a video game by rewarding it when it scores points and adjusting its actions over time.
Comparison Table
| Feature | Supervised Learning | Unsupervised Learning | Reinforcement Learning |
| Data Labeling | Uses labelled data (answers provided). | No labels, only raw data. | No labels, learns from rewards/penalties. |
| Goal | Predict specific outcomes. | Discover hidden patterns or groups. | Maximize rewards through actions. |
| Learning Style | Learns from examples with answers. | Finds structure in data on its own. | Learns by interacting with the environment. |
| Example Use | Classifying emails as spam or not. | Grouping customers by shopping habits. | Teaching robots to play games or walk. |
This makes it easy to choose the right type of learning depending on the problem you want to solve!
Factors to consider when choosing a machine learning algorithms
Choosing the right machine learning algorithms can be tricky. Let’s explore the key factors you should consider:
Type of Data
First, look at the type of data you have. Labeled datasets with defined outputs are ideal for supervised methods. Algorithms like Linear Regression and SVM fall into this category. If your data is unlabeled, unsupervised approaches are needed. These algorithms, like K-Means Clustering, identify hidden structures. For scenarios involving learning through interactions, consider reinforcement learning.
Complexity of the Problem
Next, think about the complexity of the problem. Simpler tasks can be tackled with basic algorithms. However, complex issues with intricate relationships need advanced methods. Neural networks and ensemble techniques are good choices. They require more effort and fine-tuning but can handle complexity well.
Computational Resources
Evaluate the computational power you have. Some algorithms, like deep learning models, need powerful hardware. If your resources are limited, go for simpler algorithms. Logistic Regression or K-Nearest Neighbors can still give good results without straining your system.
Interpretability vs. Accuracy
Lastly, decide between interpretability and accuracy. Do you need an algorithm that’s easy to understand? Or one that prioritizes accuracy, even if it’s a black box? Decision Trees and Linear Regression are easier to explain. This makes them great for stakeholder communication. However, more complex models like neural networks may offer better accuracy but are harder to interpret.
In summary, consider the type of data, problem complexity, computational resources, and the need for interpretability when choosing an algorithm. These factors will guide you in selecting the best method for your machine-learning project.
Conclusion
Mastering the top 10 machine learning algorithms builds a strong foundation. These algorithms help solve problems like predictions and pattern recognition. Machine learning is transforming industries and creating endless opportunities. Staying updated ensures you remain competitive in this fast-growing field.
To advance further, consider enrolling in specialized AI and machine learning programs. These programs teach advanced tools like TensorFlow and Natural Language Processing. You gain hands-on experience to tackle real-world challenges confidently. Start your journey today and lead the way in AI innovation.
Curious to dive deeper into the world of machine learning? Don’t miss these handpicked resources—explore them now and supercharge your learning journey!
Machine learning for beginners – everything you need to know
Metrics used for evaluating regression models
Need and application of regression in machine learning
What is feature scaling in machine learning
Data preprocessing methods in machine learning
Frequently faced issues in machine learning
Uses of machine learning in real life
