In a world filled with data, captivating visual storytelling is essential. Data visualization tools allow you to turn complex information into simple, engaging narratives that resonate with your audience. By using the right tools, you can make your data presentations more impactful and memorable.
Fortunately, you don’t need advanced design skills to create stunning visuals. Many free tools are available that help you craft beautiful graphics, charts, and infographics. These platforms enable you to transform raw data into compelling stories that connect with your audience emotionally and intellectually.
In this article, we’ll explore ten of the best free tools for captivating visual storytelling. Whether you’re an experienced analyst or just starting, these resources will help you bring your data to life. Let’s dive in and discover how to turn numbers into visuals that inspire and inform!
Understanding the core concept of data visualization
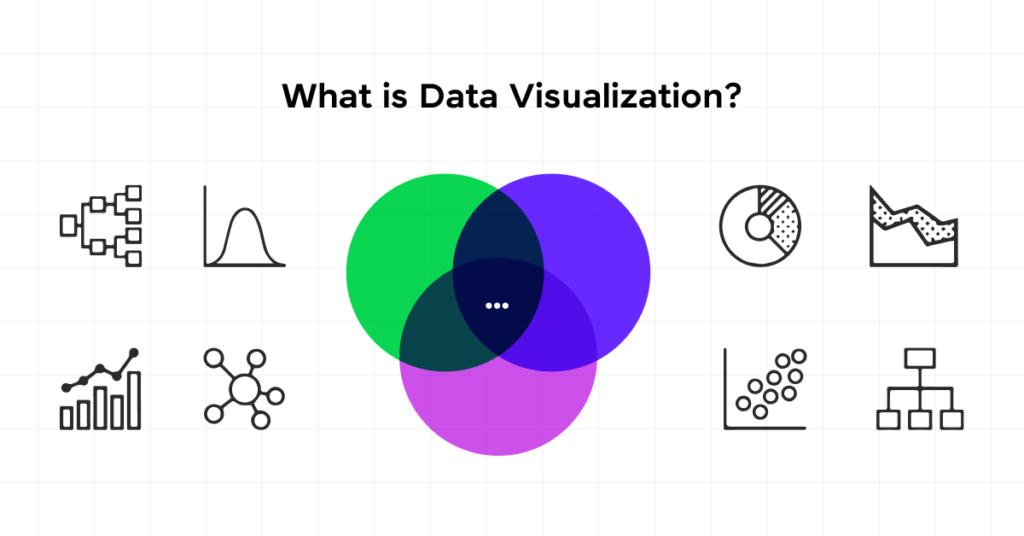
Data visualization turns complex data into clear and engaging visuals, such as charts and graphs. This method helps us spot patterns and trends that might otherwise be hidden. By using visuals, we make information accessible and easy to understand for everyone.
Additionally, data visualization is useful for a wide range of audiences. Business leaders can share insights about their organizations, while marketers track customer behavior. Ultimately, visualizing data promotes informed decision-making at every level.
By grasping the core concept of data visualization, you can unlock its full potential. As we explore this topic, you will learn how to transform raw data into meaningful stories that inspire action. Let’s dive in and discover the power of data visualization together!
Types of data visualization
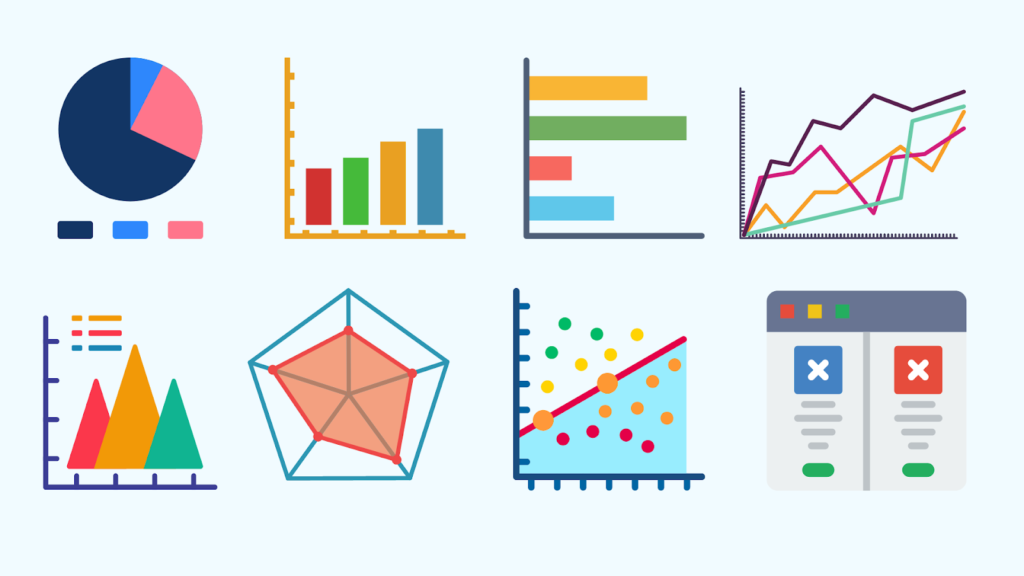
Data visualization comes in various forms, each designed to present complex data in an easy-to-digest way. By choosing the right visualization, you can tell a more compelling story with your data and help your audience grasp critical insights.
Here are some common types of data visualization:
- Bar Charts: These display comparisons across categories with rectangular bars representing data values. Ideal for comparing numbers side by side.
- Line Charts: Used to track changes over time, making trends easy to spot. Perfect for visualizing data that shows progress or fluctuations.
- Pie Charts: These circular graphs show parts of a whole, with each slice representing a percentage. They’re great for understanding the breakdown of categories.
- Scatter Plots: Show the relationship between two variables. Useful for identifying correlations or patterns in data sets.
- Heat Maps: These use colour to represent data density or frequency. Commonly used to show activity levels or highlight trends across geographic areas.
- Histograms: Visualize the distribution of numerical data across intervals, making it easy to see data concentration or outliers.
By understanding these different types, you can better choose how to visualize your data for maximum impact and clarity. Each type plays a crucial role in transforming numbers into meaningful stories.
Why is data visualization important?
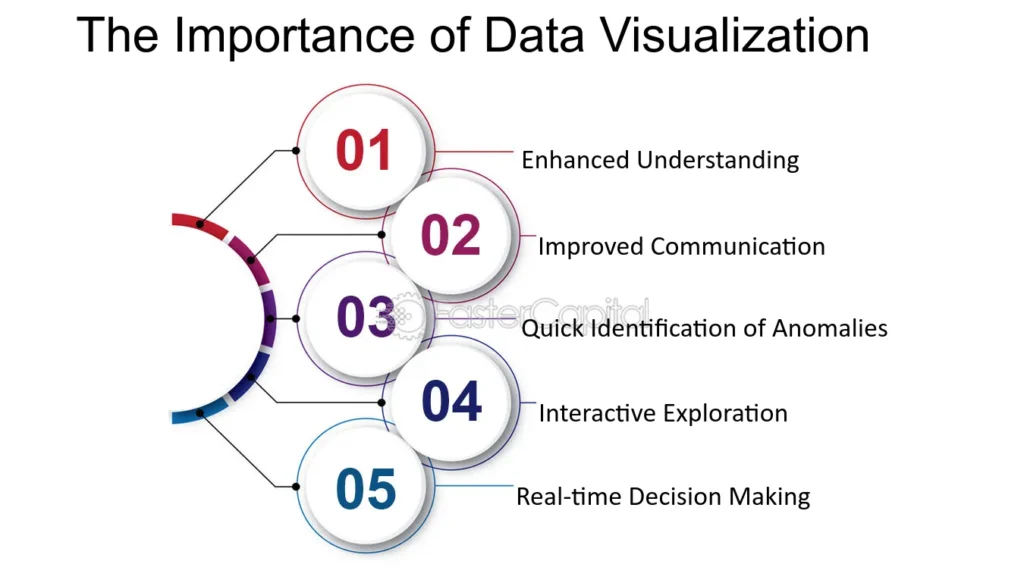
Data visualization is vital in today’s data-rich world because it allows us to comprehend information quickly and efficiently. Instead of sifting through endless rows of numbers, data visualization provides a clear, visual representation of key insights. This makes understanding complex data faster and easier for everyone, from decision-makers to analysts.
Here’s why data visualization is important:
1. Simplifies complex data
Visuals break down large, complicated datasets into simple, understandable formats. For instance, imagine you have sales data for 10 different regions over the past year. Looking at rows and columns in a spreadsheet can be overwhelming. However, a bar chart can quickly show which region outperformed others, making the data easier to interpret.
2. Enhances decision-making
Data visualization helps leaders make informed decisions by presenting critical information clearly. For example, if a business is tracking customer satisfaction across several locations, a heat map can reveal which areas are struggling. This allows management to focus on specific regions that need improvement, making decisions based on real insights, not guesswork.
3. Reveals hidden insights
Some trends are hard to notice without visualization. A scatter plot, for instance, can show a correlation between marketing spend and customer growth over time. Without this visual aid, you might not see that increased spending leads to better customer acquisition, helping to shape future strategies.
4. Improves communication
Visuals act as a universal language, bridging the gap between data experts and non-experts. If a marketing team presents customer behaviour data to executives, a pie chart showing which products perform best simplifies communication. Instead of reading through data tables, stakeholders can immediately grasp the big picture.
5. Saves time
Time is money, and data visualization helps save both. Imagine analyzing financial performance across multiple departments. A dashboard showing trends with line graphs and pie charts can highlight profit margins or losses, reducing the need to go through each department’s data manually. For instance, a red-coloured bar in a profit-loss chart can immediately signal where intervention is needed.
6. Tells a story
Visualization turns numbers into narratives. Consider a company tracking customer satisfaction over time. A line chart that shows satisfaction levels dropping during specific months can tell a story. The visual can prompt a deeper investigation, like identifying that certain months coincide with product issues, leading the company to address those specific problems and improve customer retention.
Example:
Imagine a retail company analyzing product sales. Without data visualization, they might just see long lists of numbers. But by using visuals like pie charts and bar graphs, they quickly understand which products are top-sellers, which regions generate the most revenue, and where to focus their efforts. A simple bar chart might reveal that Product A performs best in the North while Product B sells better in the South. This insight enables more targeted marketing and sales strategies.
Data visualization not only makes it easier to understand information but also drives faster and more accurate decisions, helping businesses stay ahead.
What are the Steps in the Data Visualization process?
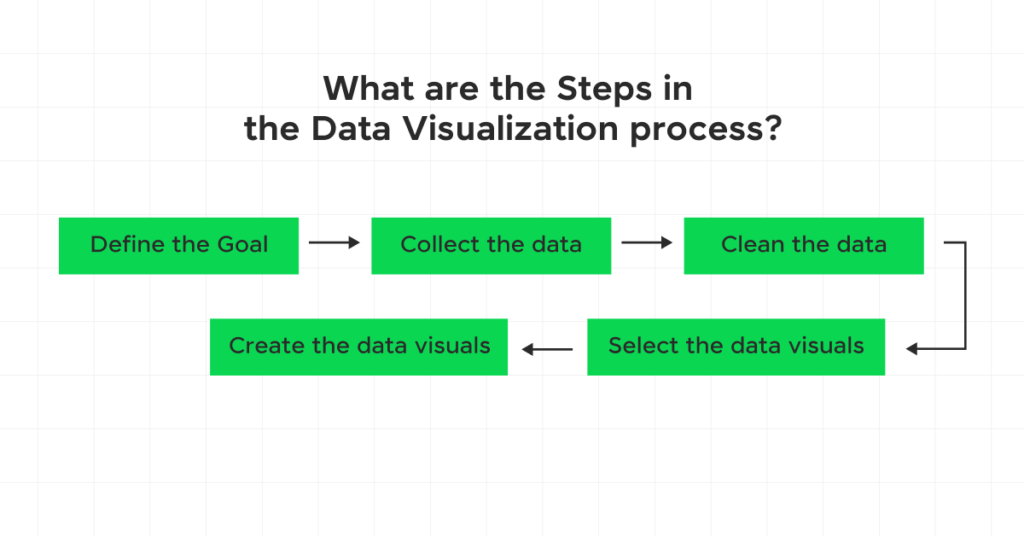
Data visualization is an essential skill that turns complex data into clear and engaging visuals. By following a structured process, you can ensure your visualizations effectively communicate your message and resonate with your audience.
Each step in this journey, from identifying your objectives to selecting the right tools, helps create a strong foundation for your visuals. Let’s dive into the key steps that will empower you to craft meaningful data representations that inspire and inform.
1. Define the Goal
Defining the goal is the cornerstone of effective data visualization. Start by asking key questions that your data can answer. This clarity will shape your entire visualization process.
Consider the following:
Purpose: What do you want to achieve? Are you trying to inform, persuade, or analyze?
Audience: Who will view your visualization? Tailoring your approach to their needs is essential.
Outcome: What actions do you want your audience to take based on your findings?
For example, a marketing team might aim to discover which campaigns yield the highest engagement. By clearly defining the goal, you set the stage for impactful visual storytelling.
2. Collect the data
Collecting data is a crucial step in the visualization process. Start by identifying both internal and external sources. Your organization may have valuable data archives that can be analyzed, while numerous online datasets are available for purchase or free access.
For instance, a company looking to improve sales might gather historical sales figures, customer feedback, and market trends. This diverse collection of data allows for a comprehensive analysis, setting a strong foundation for insightful and impactful visualizations. The more relevant data you gather, the clearer your story will become.
3. Clean the data
Cleaning the data is essential for creating accurate visualizations. This process involves removing errors, duplicates, and irrelevant information that can distort your findings. By filtering and organizing your data, you ensure it meets the criteria needed to answer your initial questions.
For example, if you’re analyzing sales, you might exclude holiday season data to focus on typical trends. This step enhances the quality of your analysis and helps you present a clearer, more reliable story through your visuals. Clean data is the key to effective communication. Want to know more about data preprocessing:
Data Preprocessing Methods in Machine Learning
4. Select the data visuals
Choosing the right visuals is crucial for effectively communicating your data story. The type of insights you want to share will guide your selection. Consider what message you want to convey and how best to represent that information.
Here are two main categories of data visualizations:
Static Visualization
These provide a single view of your data. Examples include infographics or simple charts that convey a specific message without interactivity.
Interactive Visualization
These allow users to engage with the data. Viewers can manipulate charts to explore different aspects, uncovering deeper insights. Dashboards are a common example of this type.
By carefully selecting visuals, you enhance understanding and keep your audience engaged. The right choice transforms complex data into compelling narratives.
5. Create the data visuals
Once you’ve selected the appropriate visuals, it’s time to bring them to life. Data visualization tools can simplify this process. They often import your dataset and create reports automatically.
To enhance the effectiveness of your visuals, keep these design principles in mind:
Highlight Key Details: Use sizes, colours, and graphics to draw attention to important information.
Provide Context: Include visual cues that help explain the data’s significance.
Choose Colors Wisely: Opt for colour combinations that are easy to read and understand.
Use Clear Titles: Explanatory titles guide your audience, helping them focus on crucial insights.
Label Clearly: Include straightforward labels and numbers for easy comprehension.
By following these steps, you can create impactful visuals that engage and inform your audience.
The top 10 free data visualization tools to explore in 2025
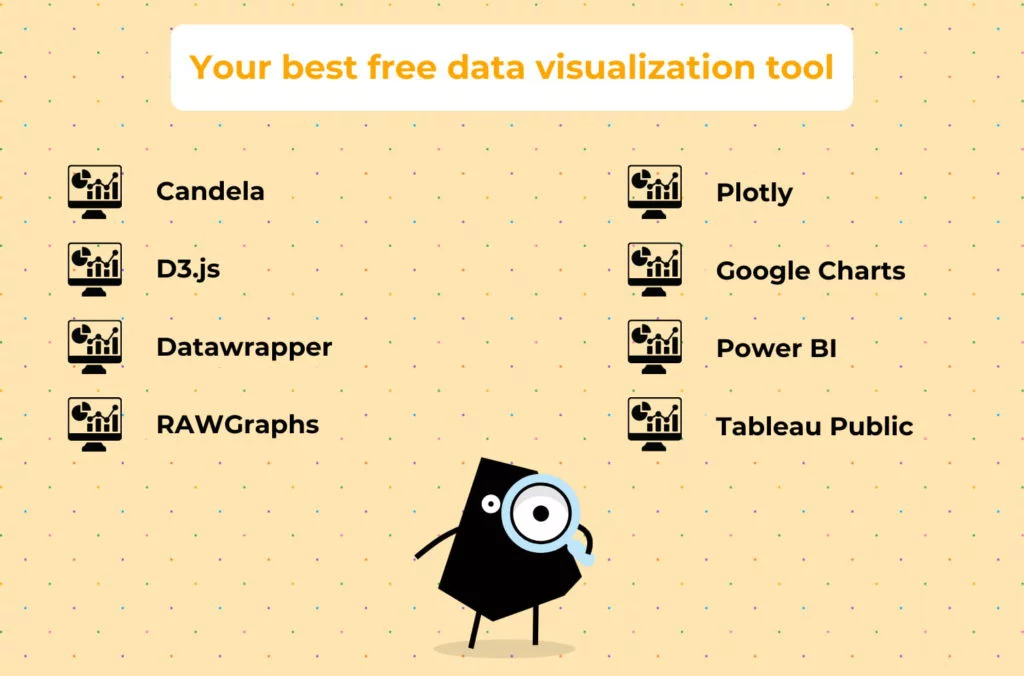
In 2025, data visualization will be more essential than ever for turning complex information into clear insights. Here are the top 10 free tools that can help you create stunning visuals and make data easier to understand. Dive in for details.
1. Tableau Public
Tableau Public is a powerful free tool that makes creating stunning data visualizations easy and accessible. With its wide range of chart options, from bar graphs to intricate heat maps, you can turn raw data into interactive visuals that engage and inform your audience. It’s ideal for users who want to experiment with data storytelling without the need for programming skills.
The tool supports various data sources like CSV and Excel, allowing you to integrate your data seamlessly. While Tableau Public offers incredible features, keep in mind that your projects will be publicly accessible. It’s a perfect choice for those seeking creativity and interactivity in data presentation.
2. Google Data Studio
Google Data Studio, now known as Looker Studio, is a versatile free tool for creating interactive dashboards and reports. It allows you to pull data from multiple sources like Google Sheets, Excel, and BigQuery, making it a perfect option for users who want seamless integration and real-time data analysis. With customizable templates and intuitive drag-and-drop features, it’s easy to craft engaging visualizations.
Google Data Studio stands out because of its connectivity to real-time data sources such as YouTube, MySQL, and social media platforms. This powerful tool simplifies data visualisation and encourages collaboration by allowing easy sharing and real-time updates, making it an essential tool for businesses.
3. Microsoft Power BI
Microsoft Power BI is a powerful tool for transforming raw data into insightful visualizations. Known for its seamless integration with over 70 data sources, including Excel and cloud services, Power BI helps users create dashboards and reports without needing any coding skills. The free version allows you to build dynamic charts, heatmaps, and scatter plots, offering a rich set of features for data analysis.
What sets Power BI apart is its simplicity and versatility. The drag-and-drop interface makes it accessible to beginners, while its robust features support complex data models for advanced users. Whether you’re a business professional or a data enthusiast, Power BI can elevate how you visualize and share your insights.
4. Datawrapper
Datawrapper is a user-friendly, free tool designed to make creating data visualizations simple and accessible. With it, you can easily craft interactive charts, maps, and tables without any technical expertise. The platform is ideal for quickly building visuals that can be embedded in websites, shared, or printed, making it a go-to option for journalists, marketers, and educators alike.
What makes Datawrapper stand out is its focus on clean, professional design. It offers customizable templates that adapt beautifully to different screen sizes, ensuring your data looks great everywhere. Whether you’re presenting data to millions of viewers or just a small audience, Datawrapper helps you tell compelling stories through visuals.
5. Google Charts
Google Charts is a free and user-friendly tool for creating interactive charts. You can easily embed these charts into your websites or apps. It offers various types of visualizations, from simple pie charts to detailed geo maps. This flexibility allows you to customize your charts using HTML and JavaScript.
For those who know a bit about coding, Google Charts lets you use dynamic data that updates in real-time. It connects seamlessly to Google Sheets, SQL databases, and other data sources. Plus, it uses HTML5 and SVG, ensuring your charts work well on all modern browsers without any extra plugins. Whether you need charts for business reports or web presentations, Google Charts helps you showcase your data beautifully.
6. RawGraphs
RawGraphs is a fantastic tool for anyone looking to create beautiful data visualizations without any coding skills. With its simple drag-and-drop interface, you can easily turn your data into eye-catching charts and graphs. It offers various chart types, such as bar charts, scatter plots, and maps, allowing you to find the perfect way to display your information. You can also customize your visualizations to suit your needs, ensuring they effectively communicate your insights.
What sets RawGraphs apart is its commitment to data security. Your data is processed entirely in your web browser, so it never leaves your device. If you’re eager to create interactive visuals using the D3 library, RawGraphs makes it straightforward. Just paste your data, select a chart type, and customize it to your liking. While it has a smaller library of chart options, the ability to style your creations easily and embed them on your website makes RawGraphs a powerful choice for data enthusiasts.
7. Infogram
Another exciting data visualization tool is Infogram which combines ease of use with impressive visuals. Perfect for non-technical users, it allows marketers, journalists, and educators to create stunning infographics and interactive charts effortlessly. With a drag-and-drop interface, you can quickly build your projects using over 35 chart types. While the free version limits you to 10 creations, it offers a fantastic way to explore its features and capabilities without any technical barriers.
What makes Infogram stand out is its focus on creating visually appealing content for various platforms, from social media posts to presentations. Although you can’t keep your projects private with the free account, it’s a great starting point to make your data look engaging. Infogram proves that anyone can transform complex information into beautiful visuals, no expertise is needed.
8. Plotly
Plotly is a fantastic open-source tool for creating interactive data visualizations. Unlike many other tools that only offer static graphics, Plotly lets you make visuals where you can hover over data points and zoom in for more details. This feature is great for spotting trends and outliers. With over 40 chart types available, it suits various fields, from finance to science, making it a favourite among data scientists.
While Plotly offers many customization options, it may take some time to learn. However, if you want to improve your Python skills, mastering Plotly is worth it. You can create beautiful web-based visuals to share your insights effectively. Plus, since it’s completely free, you can unleash your creativity without any costs.
9. D3 (Data-Driven Documents)
D3, or Data Driven Documents, is a powerful JavaScript library for creating stunning data visualizations. While it may not be the easiest tool to learn, its flexibility is unmatched. Once you grasp its coding concepts, you can create anything from simple charts to complex interactive diagrams. D3 allows you to fully customize your visuals, so your only limit is your imagination. The results are often breathtaking and highly engaging for your audience.
Though D3 may not be the best choice for beginners, it’s an exciting challenge for those ready to dive deeper. By investing time in learning D3, you’ll gain the skills to craft unique visual stories that captivate viewers. Embrace the journey and unlock a world of creative possibilities!
10. Flourish
Flourish is a powerful tool that makes data visualization fun and engaging. It offers a variety of easy-to-use templates, allowing you to create interactive charts, detailed maps, and animated stories. With Flourish, you can turn complex data into clear visuals that grab attention and make understanding easier.
What really makes Flourish special is that you don’t need coding skills to use it. Anyone can design stunning visualizations, like interactive presentations and scrolling narratives. This means marketers, educators, and journalists can effectively share their data stories without technical barriers. Explore Flourish to elevate your presentations and make your data shine!
Conclusion
In conclusion, understanding data visualization tools is essential for anyone working with data. These tools help turn complex information into clear visuals that everyone can understand. By using them, students and professionals can tell better stories, share insights effectively, and make smarter decisions.
As we step into a more data-driven future, the importance of these tools will only grow. Exploring these free options allows you to create eye-catching visuals, opening up new ways to communicate your ideas. Whether you’re a computer science student or a data expert, mastering these tools will elevate your work and help your data stand out.
If you want to know more about the details of how to kickstart your career in data analysis. Please check our link below:
Launching Your Data Analyst Career: Expert Advice for Success
